2RedBeans
Should You Move for Love? We Pulled Real Dating Data on 16 North American Cities
"If dating is part of the calculus, which city should I actually move to?" It's the question single Chinese professionals in North America run in the back of their minds constantly — and answer with vibes, because nobody has ever had the numbers. The internet's answers are all stereotype: "the Bay Area is a monastery," "New York has endless options and zero intentions." They sound right. Nobody can prove any of it.
This article can. We pulled real platform data across 16 North American metro areas — gender ratios, how often a "like" turns mutual, how many matches cross city lines — and turned it into something you can actually look up before you sign a lease.
First, where this data comes from
The one-sentence version: every number below comes from real 2RedBeans members who were active in the last 90 days (inactive, hidden, and suspicious accounts removed), across 16 North American metros. A "match" means both people liked or favorited each other within the past 12 months — mutual interest expressed, not a couple walking down the aisle. There's a full methodology note at the end.
Okay. The numbers.
The gender ratio map: men outnumber women everywhere — but not equally
Let's start with a fact that will sting a lot of men and surprise a lot of women: across all 16 metros, without a single exception, men outnumber women.
| City | Active men per 100 active women |
|---|---|
| Los Angeles | 127 |
| Houston | 142 |
| Bay Area | 146 |
| New York | 162 |
| Vancouver | 163 |
| Seattle | 164 |
| Boston | 167 |
| Atlanta | 178 |
| Washington, DC | 182 |
| Toronto | 184 |
| Dallas | 201 |
| Philadelphia | 203 |
| Chicago | 226 |
| Austin | 270 |
| San Diego | 314 |
| Montreal | 339 |
(Based on 90-day active members, rounded.)
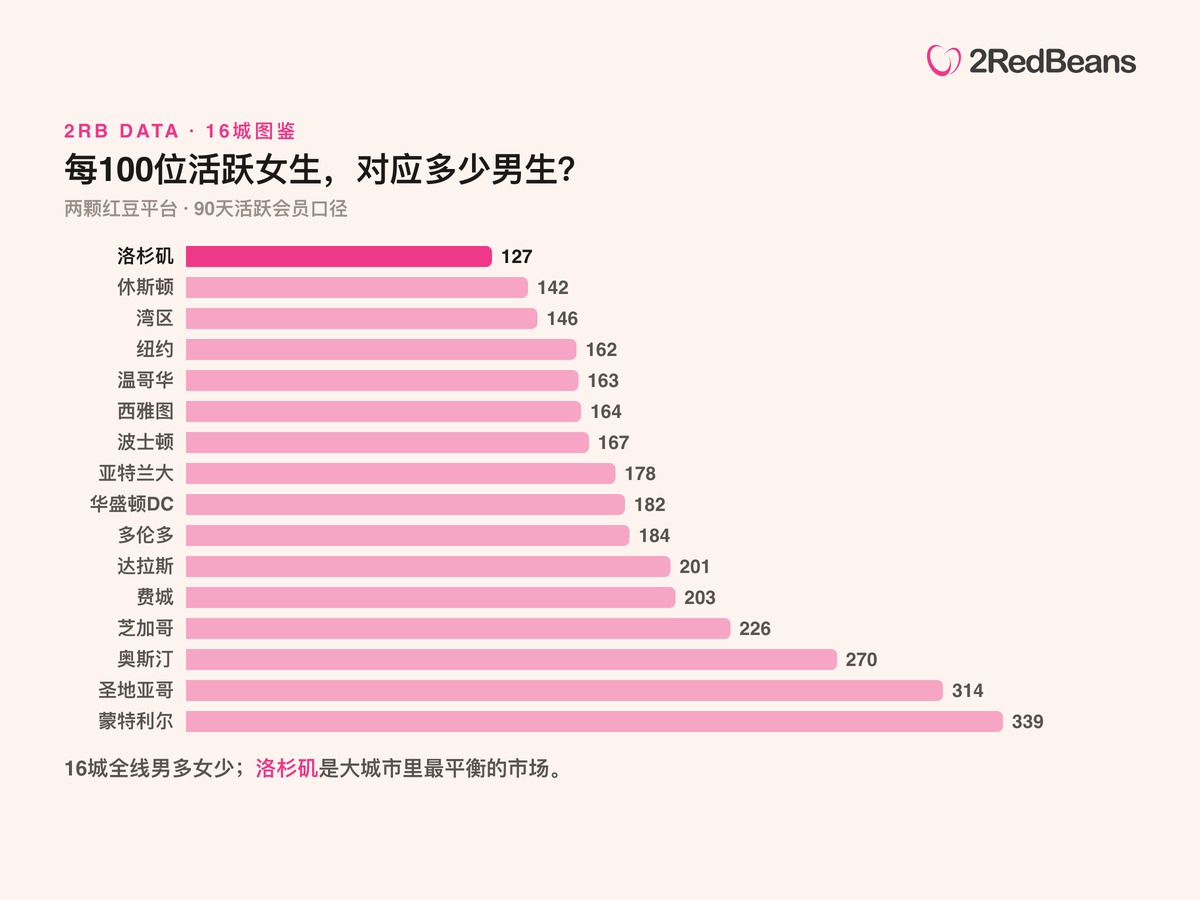
Los Angeles is the most balanced big-city market: 127 men per 100 women. Houston and the Bay Area are right behind it. Yes, you read that correctly — the Bay Area, the place everyone jokes is one giant software-engineer monastery, is actually more balanced than New York (162) and Toronto (184). Stereotypes will steer you wrong.
The smaller markets swing to extremes: Montreal at 339, San Diego at 314, Austin at 270. One caveat — the active member pools in these cities are small to begin with, so treat those ratios as directional, not gospel.
Where do likes actually become mutual? Vancouver. Surprised?
Headcount alone tells you nothing. What matters is how many of the likes people send actually come back.
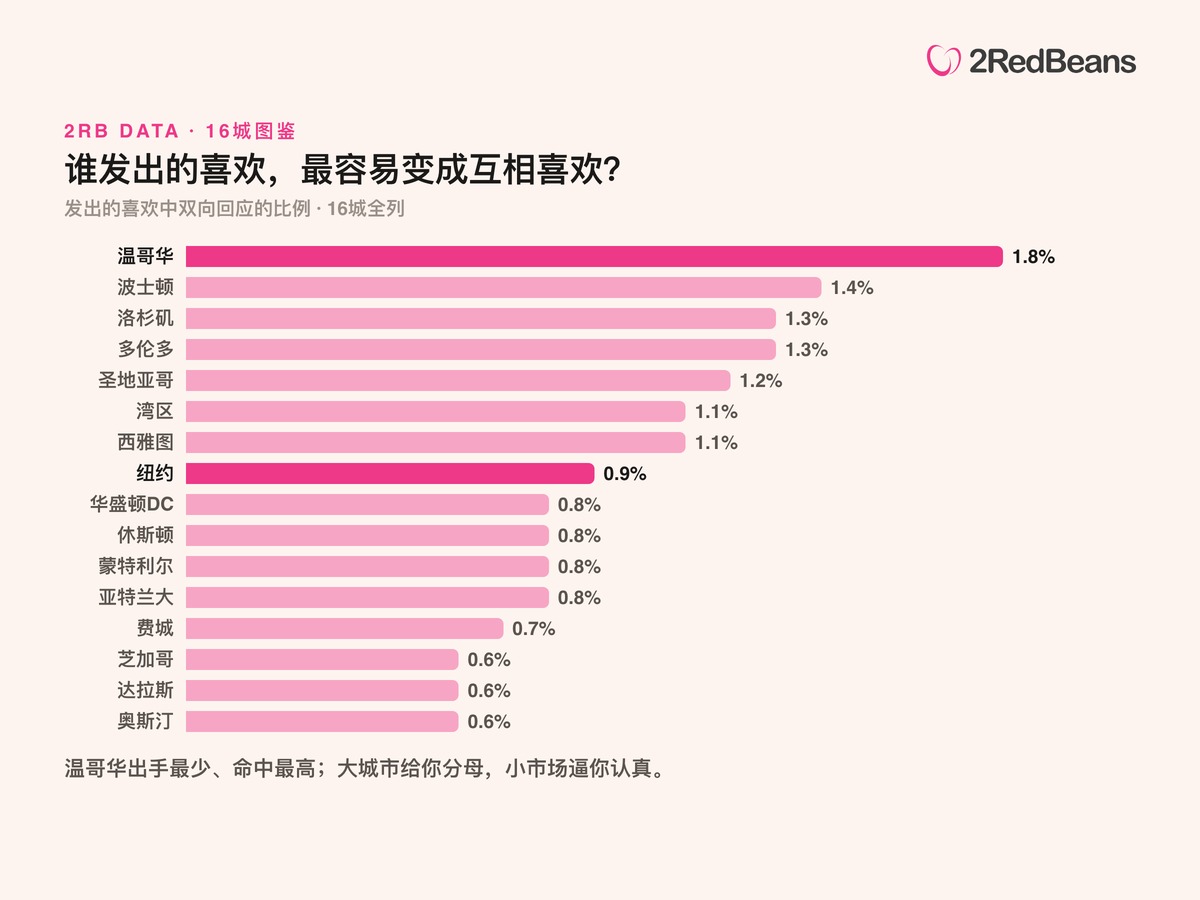
The champion on conversion is Vancouver: 1.8% — roughly two to three times Chicago, Dallas, and Austin (all at 0.6%). Boston does well at 1.4%, Los Angeles and Toronto at 1.3%; New York manages only 0.9%.
Here's the interesting part. New York sends more likes than any other city on the platform, yet ranks in the bottom half on conversion. Vancouver sends about one-sixth as many likes as New York — and has the best hit rate of all 16. Our read: these are two different market ecosystems. One is "abundant but swipe-happy" — so many options that every like is tossed off casually. The other is "small but deliberate" — the pool is limited, so people actually read the whole profile before making a move.
Put bluntly: big cities give you a bigger denominator; smaller markets force you to be intentional. Both are legitimate ways to date.
The match-activity index: Atlanta and DC are the dark horses
We also computed a match-activity index — 12 months of mutual-like pairs divided by 90-day active members. Fair warning: this is a relative intensity measure for comparing cities against each other, not your personal odds of finding someone. Don't take it personally.
Near the top: Atlanta, Washington DC, Seattle, and Los Angeles. Near the bottom: Philadelphia, Toronto, San Diego — and Vancouver.
Wait, wasn't Vancouver just crowned the conversion king? Exactly — Vancouver members make few moves, but accurate ones, so total interaction volume stays modest. Cities like Seattle and DC are the opposite: mid-sized member bases with unusually busy matching activity. A city can be precise, or it can be hot. Those are two different things.
How to read this if you're picking a city
For men: If ratio is your only criterion, Los Angeles, Houston, and the Bay Area are the least brutal markets. Steer clear of the 300+ extremes like Montreal and San Diego — unless you're very confident in your profile and your photos.
For women: On paper, you're the scarce side in Montreal, San Diego, and Austin. But we have to be honest with you: those pools are small, and "the ratio favors you" is not the same as "there are more right people for you." In a 339-to-100 city, the total number of viable options might be smaller than a single New York zip code. More than a decade of consultations has confirmed the same lesson over and over: the ratio sets the difficulty; the pool size sets the ceiling. You have to look at both.
So if I'm forced to pick one city purely for dating, my admittedly biased answer is Los Angeles — the most balanced ratio, the largest active member base on the entire platform, and a top-four match-activity index. Whether uprooting your life for your dating odds is worth it is, of course, a whole other article.
What our matchmakers see: city personality shows up in dating pace
No data in this section — just years of front-line observation from our matchmaking consultants.
Bay Area dating runs on a calendar: a 30-minute coffee chat, efficient feedback, a second date planned like a sprint. New York dating is a social production — gallery openings, rooftop bars — fast-paced, but with firm boundaries. The Canadian cities are slow burners: Toronto and Vancouver members tend to chat much longer before meeting, but once they do meet, they're noticeably more serious. Which might be exactly what's behind Vancouver's 1.8%.
No pace is better than another. But knowing which pace suits you matters more than knowing any ratio.
Long distance isn't a dead end — it's the majority
The last number might be the most upside-down finding in this whole piece.
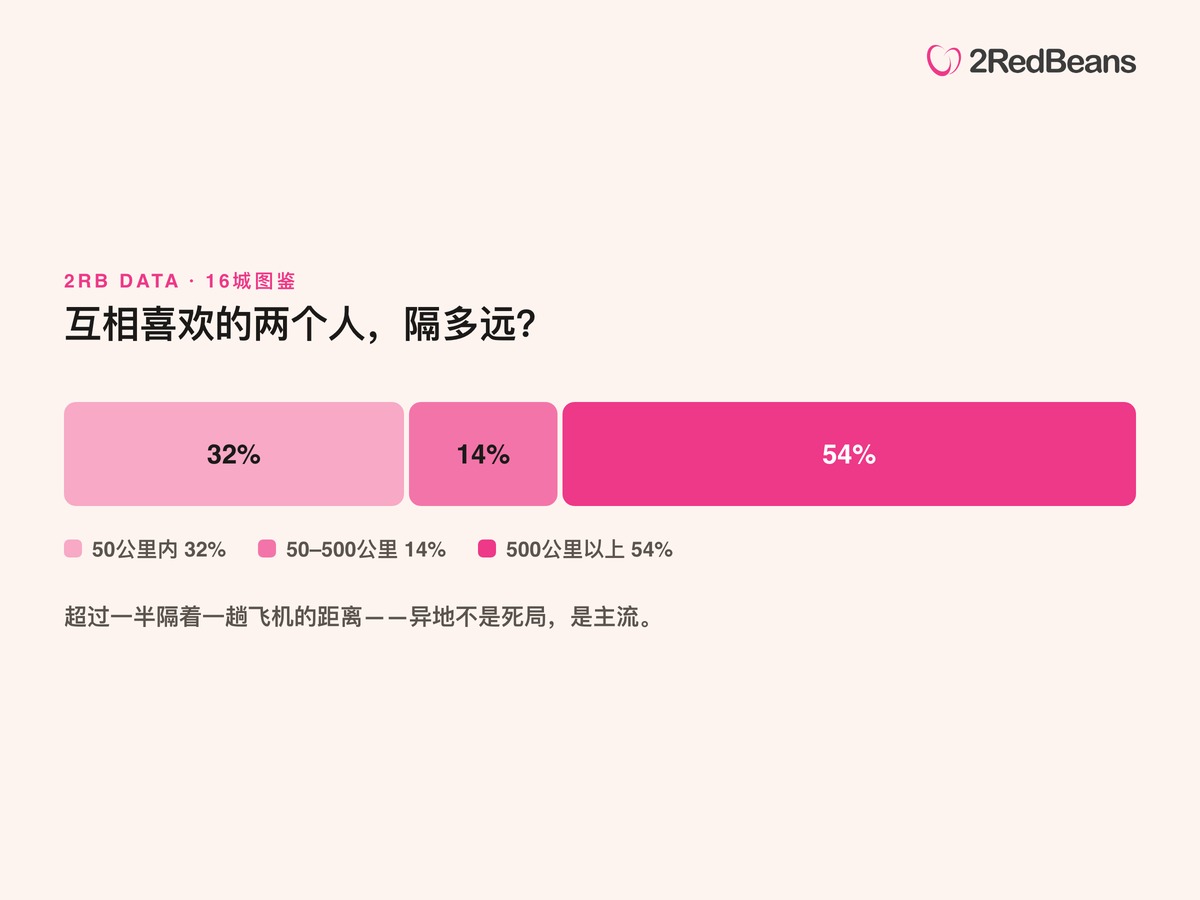
Among mutual-like pairs where both people could be placed in a metro area, 60.5% crossed metro lines. Break it down by distance and only about a third were within 50 km (about 30 miles) of each other — while 54% were more than 500 km (300+ miles) apart.
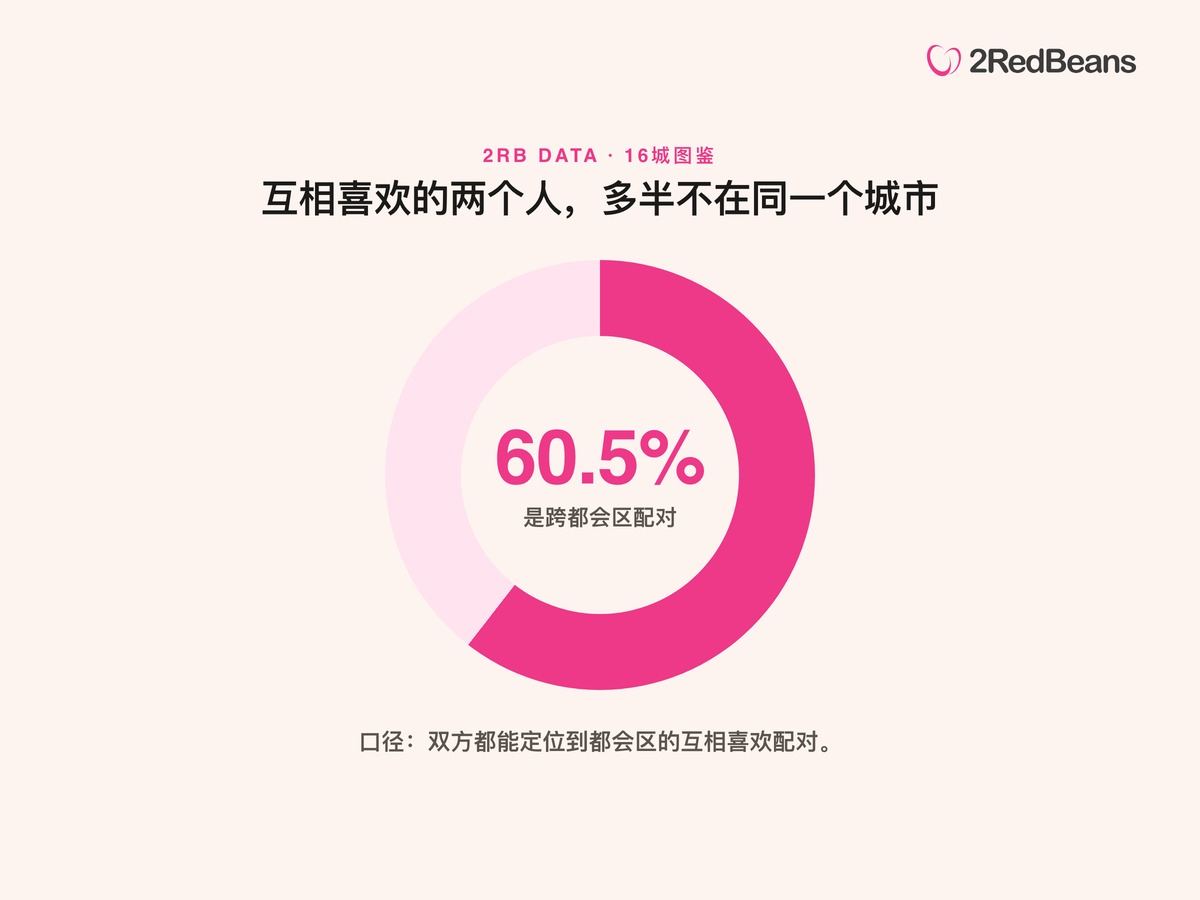
In other words, when two people express mutual interest on 2RedBeans, more than half the time they're a flight apart. One honest caveat: favoriting someone is a low-cost gesture, so this number probably overstates how many people would actually get on that plane. The precise claim is this — most members are willing to express interest across city lines. But even heavily discounted, it's enough to demolish the default setting of "only search my own city." Chinese communities in North America are scattered by nature; pinning your search radius to 30 miles might be the single biggest mismatch you're creating for yourself.
Back to the opening question: so where should you move?
After all the data, the answer compresses into one line: your city sets the denominator; your actions set the numerator. Moving to a friendlier market only turns the difficulty down one notch. How your profile reads, how quickly you reply, whether you'll give a few extra conversations to someone 300 miles away — that's the numerator, and it's all yours.
If you want a strategy for the city you're already in — or you're genuinely standing at the "should I move" crossroads — you can book a one-on-one session with a 2RedBeans matchmaking consultant. What we know about each of these cities goes well beyond what fits in one article.
And if your real question isn't "where do I look" but "what kinds of couples actually go the distance," read on to the 5 pairings that keep working out for Chinese singles in North America — geography and chemistry are two different dimensions entirely.
Methodology
Data was pulled from the 2RedBeans production database on July 4, 2026 — city-level aggregates only, no personal information of any kind. "Active single members" means real members with visible profiles and on-platform activity in the past 90 days (staff, test, and anomalous accounts excluded). Members were assigned to the nearest of 16 North American metro centers by coordinates (the Bay Area includes both San Francisco and San Jose); active members outside these 16 metros were excluded from city comparisons. A "match" means both people favorited (mutually liked) each other within the past 12 months, deduplicated. Cross-metro percentages are based only on pairs where both members could be geolocated to a metro (roughly one-fifth of all pairs). The match-activity index is the ratio of 12-month matches to 90-day active members, used solely for relative comparison between cities; absolute per-city values are not published. 2RedBeans, founded in 2011, is North America's largest dating platform for Chinese singles, with over 2 million members.
Frequently Asked Questions
Q: Which North American city has the most active Chinese singles on dating platforms? A: By 2RedBeans' 90-day active member count, Los Angeles leads, followed by the Bay Area, New York, Toronto, and Vancouver — the top five are well ahead of the rest. (This reflects active membership on a dating platform, not census-level Chinese population figures.)
Q: Which North American city has the most balanced gender ratio among Chinese singles on dating platforms? A: By 2RedBeans platform data, Los Angeles is the most balanced — about 127 active male members per 100 female members — with Houston (142) and the Bay Area (146) close behind. Men outnumber women in all 16 metros. Note that this measures people actively looking for a serious relationship, not the census ratio — and for your dating life, the former is the number that actually matters.
Q: Is looking for a partner in another city realistic? A: The data says it's worth a try: among mutual-like pairs where both members could be geolocated to a metro, 60.5% crossed metro lines, and 54% were more than 500 km (300+ miles) apart. Favoriting is a low-cost gesture, so those figures may run high — but at minimum, they show most members are open to expressing interest across cities. Locking your search to your own city may be the biggest limit you're placing on yourself.
Cover image generated by MiniMax