2RedBeans
Los Angeles Chinese Singles: Why 'Strong Women, Weak Men' Misses the Full Picture
You hear it all the time in the community: "The women these days, they're out-educating the guys, out-earning them—it's basically strong women, weak men." We decided to test that claim against actual data from LA's Chinese singles scene. Using census records plus a full year of anonymized 2RedBeans platform activity, here's what we found: Yes, single women do have more degrees. Yes, more of them are working. But on income? Men and women are basically on the same level. And online? LA's single men aren't being overlooked at all.
This is the next piece in our regional data series—we've already dug into the Bay Area and New York. The full methodology is at the bottom.
How Many Chinese People Live in LA?
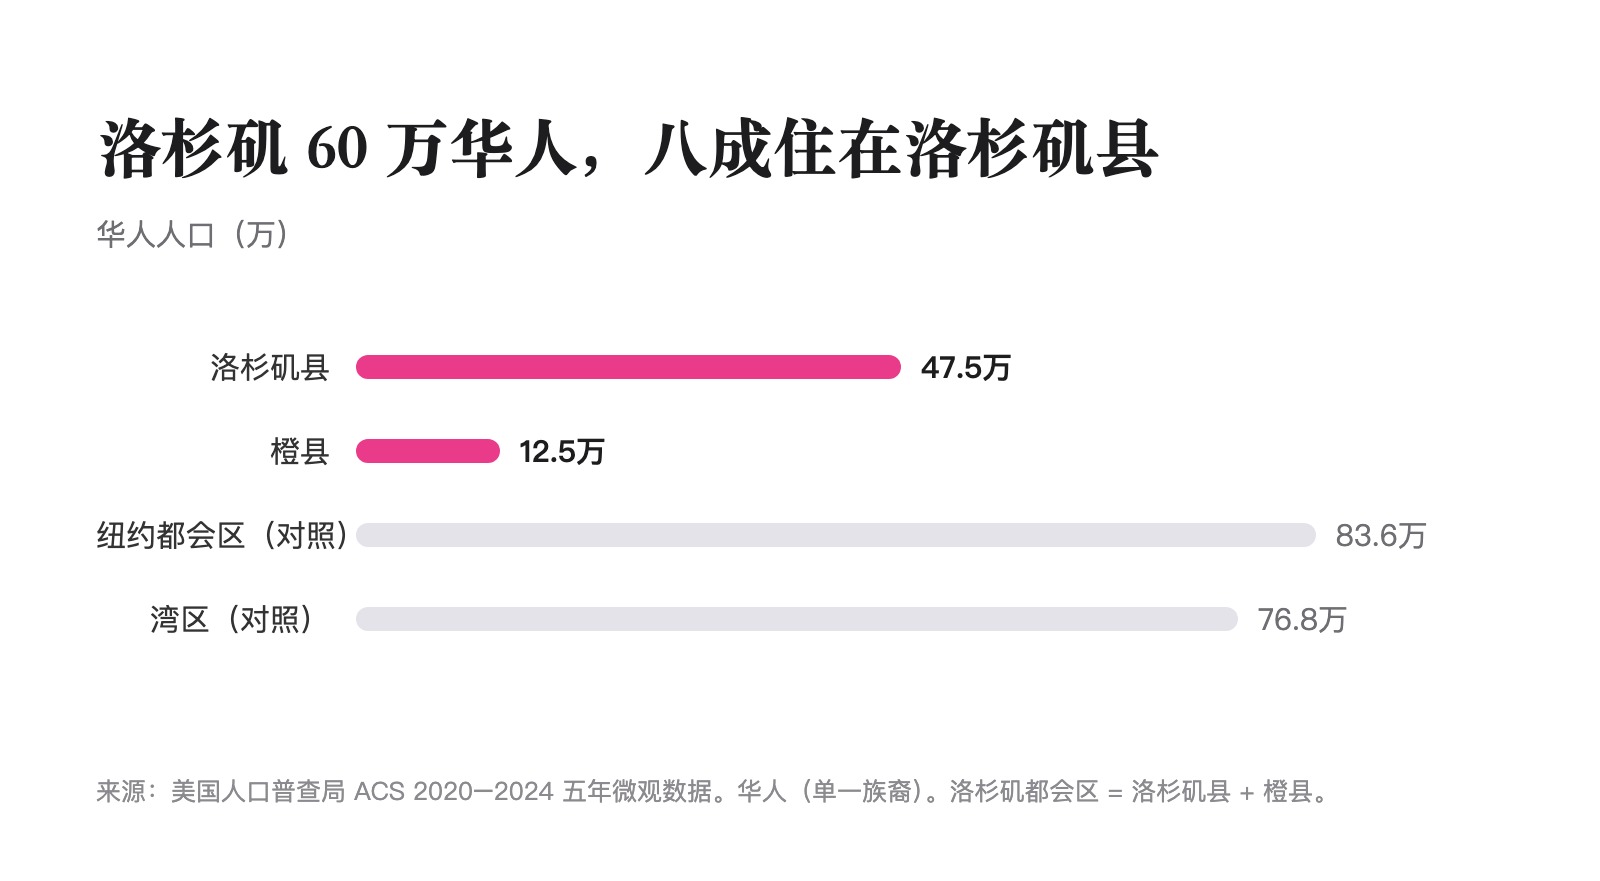
According to census data, the LA metro area—Los Angeles and Orange Counties combined—is home to roughly 600,000 Chinese residents. That's a bit less than New York's 836,000 or the Bay Area's 768,000. LA County itself accounts for about 475,000, nearly 80% of the total. Orange County makes up the remaining 125,000.
Single Men and Women: Pretty Much a Tie
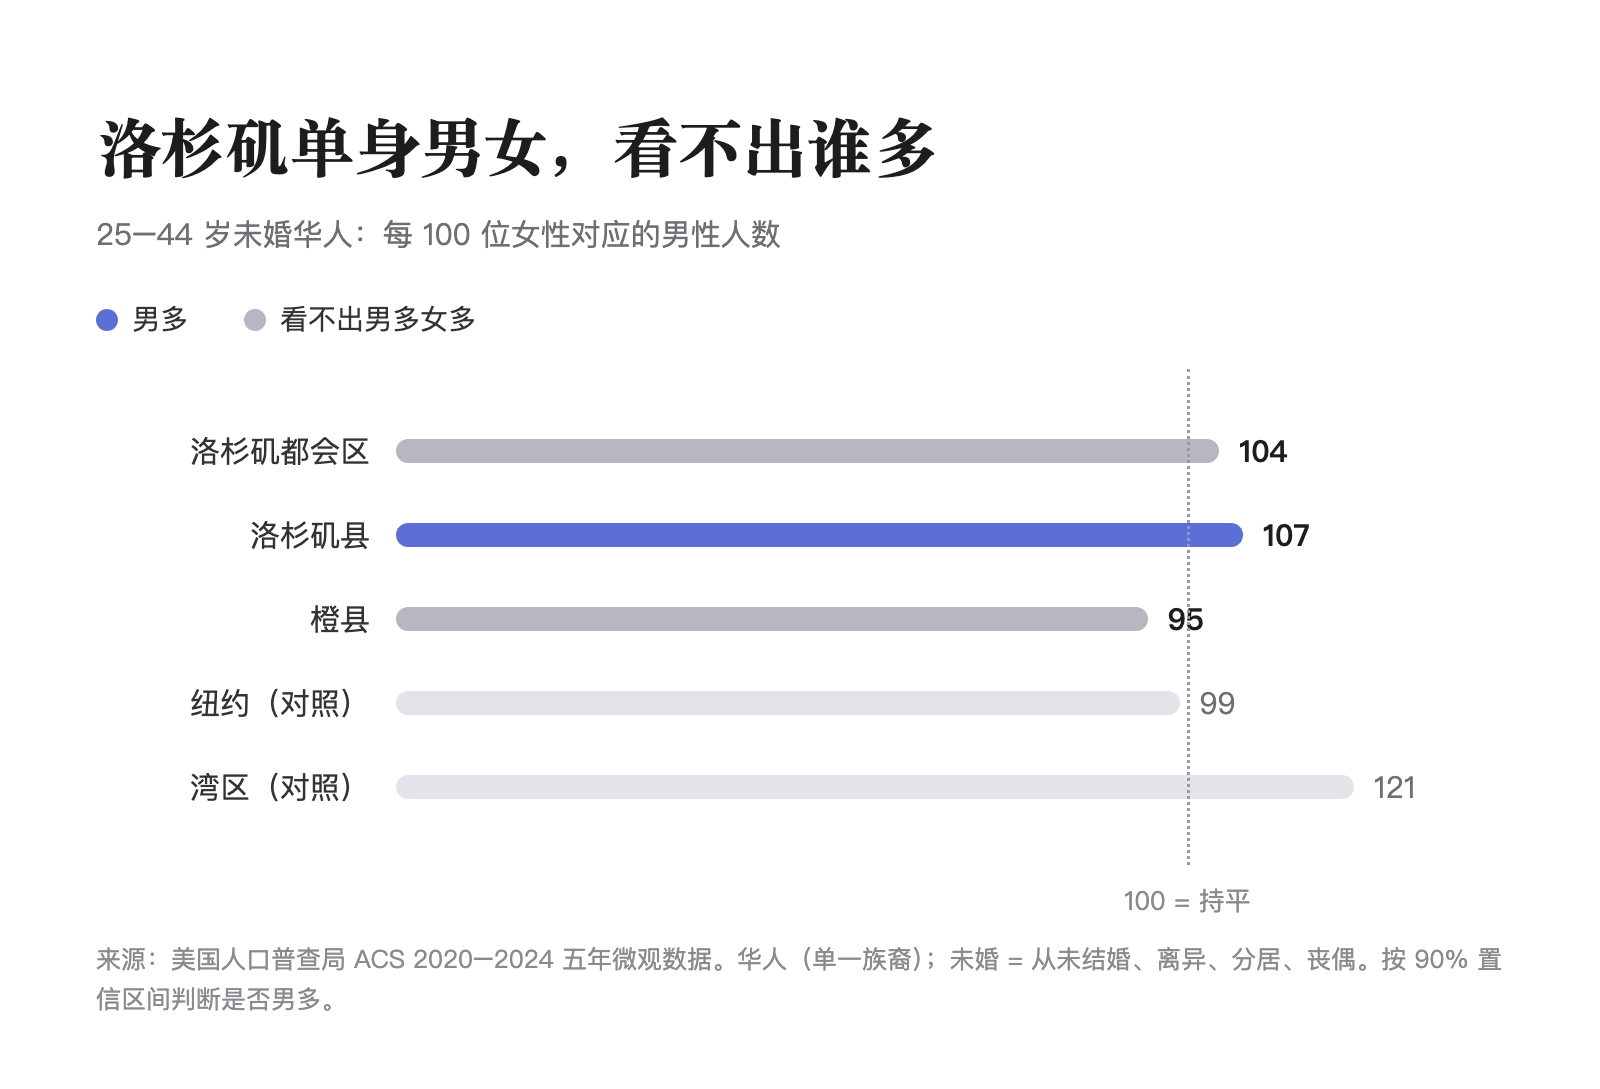
Among never-married Chinese people aged 25 to 44 in the LA metro area, we're looking at roughly 43,000 men and 42,000 women, or about 104 men for every 100 women. That's close enough that statistically you can't call it a difference—it's basically a tie, same as New York (99). The Bay Area, though, skews noticeably more toward men (121). Zooming in: LA County runs about 107 men per 100 women (a slight male edge), while Orange County is around 95 (too small a sample to say for sure).
Here's the breakdown by age group:
| Age Range | Single Men | Single Women | Men per 100 Women |
|---|---|---|---|
| 18–24 | 22,600 | 22,900 | 99 |
| 25–29 | 17,300 | 16,700 | 103 |
| 30–34 | 12,100 | 11,400 | 107 |
| 35–39 | 8,200 | 7,200 | 114 |
| 40–44 | 5,800 | 6,300 | 92 |
| 45–54 | 7,600 | 12,600 | 60 |
| 55–64 | 7,300 | 11,900 | 62 |
| 65+ | 9,900 | 30,900 | 32 |
| Total (18+) | 90,900 | 119,900 | 76 |
Under 45, most age brackets are pretty even—the only real exception is 35–39, where men outnumber women 114 to 100. After 45, single women heavily outnumber men, hitting 60 per 100 in the 45–54 range. But here's the thing: if you look only at people who've never been married, that ratio evens out to 95. The extra single women in the older age groups are mostly divorced or widowed, not never-married.
The Education Gap Is Real
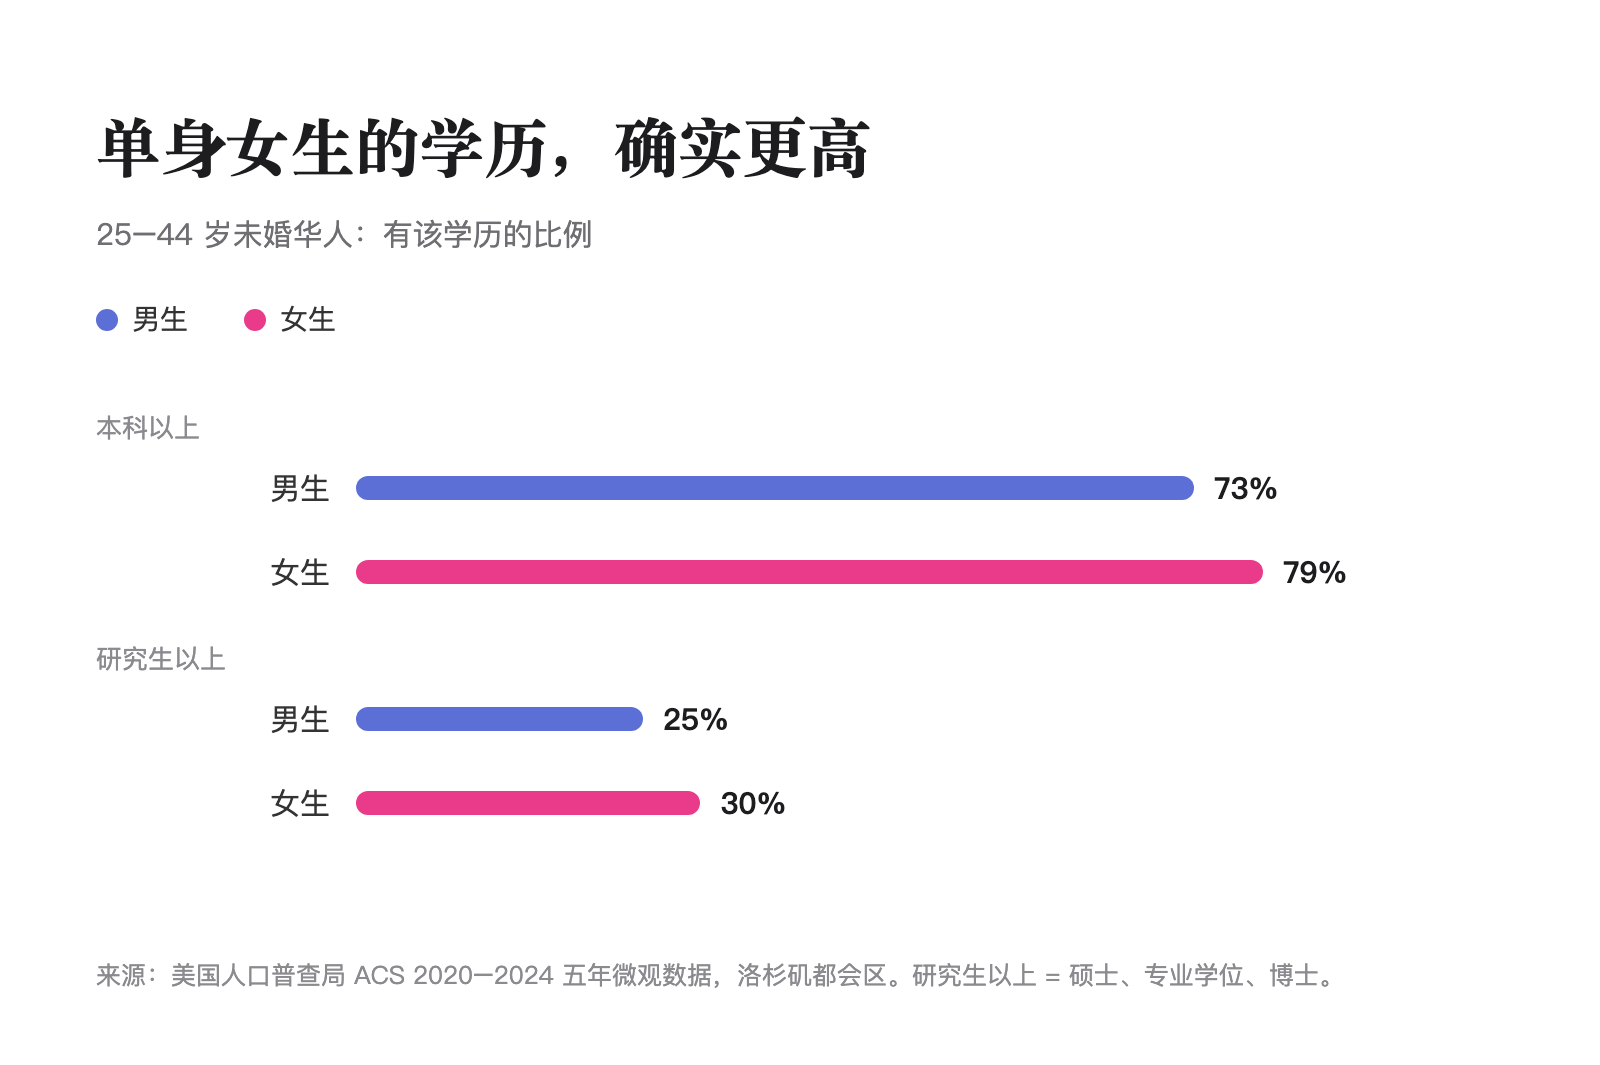
Here's where the data backs up the narrative—at least partly. Among never-married Chinese people aged 25 to 44 in LA, 79% of women have a bachelor's degree or higher, compared to 73% of men. For graduate degrees, it's 30% of women versus 25% of men. On employment, 82% of women are working compared to 78% of men.
We see the same pattern in New York (78% of women vs. 70% of men with degrees), so yes, "single women are more educated" holds up. The data backs that one.
The Income Story: It's More Complicated
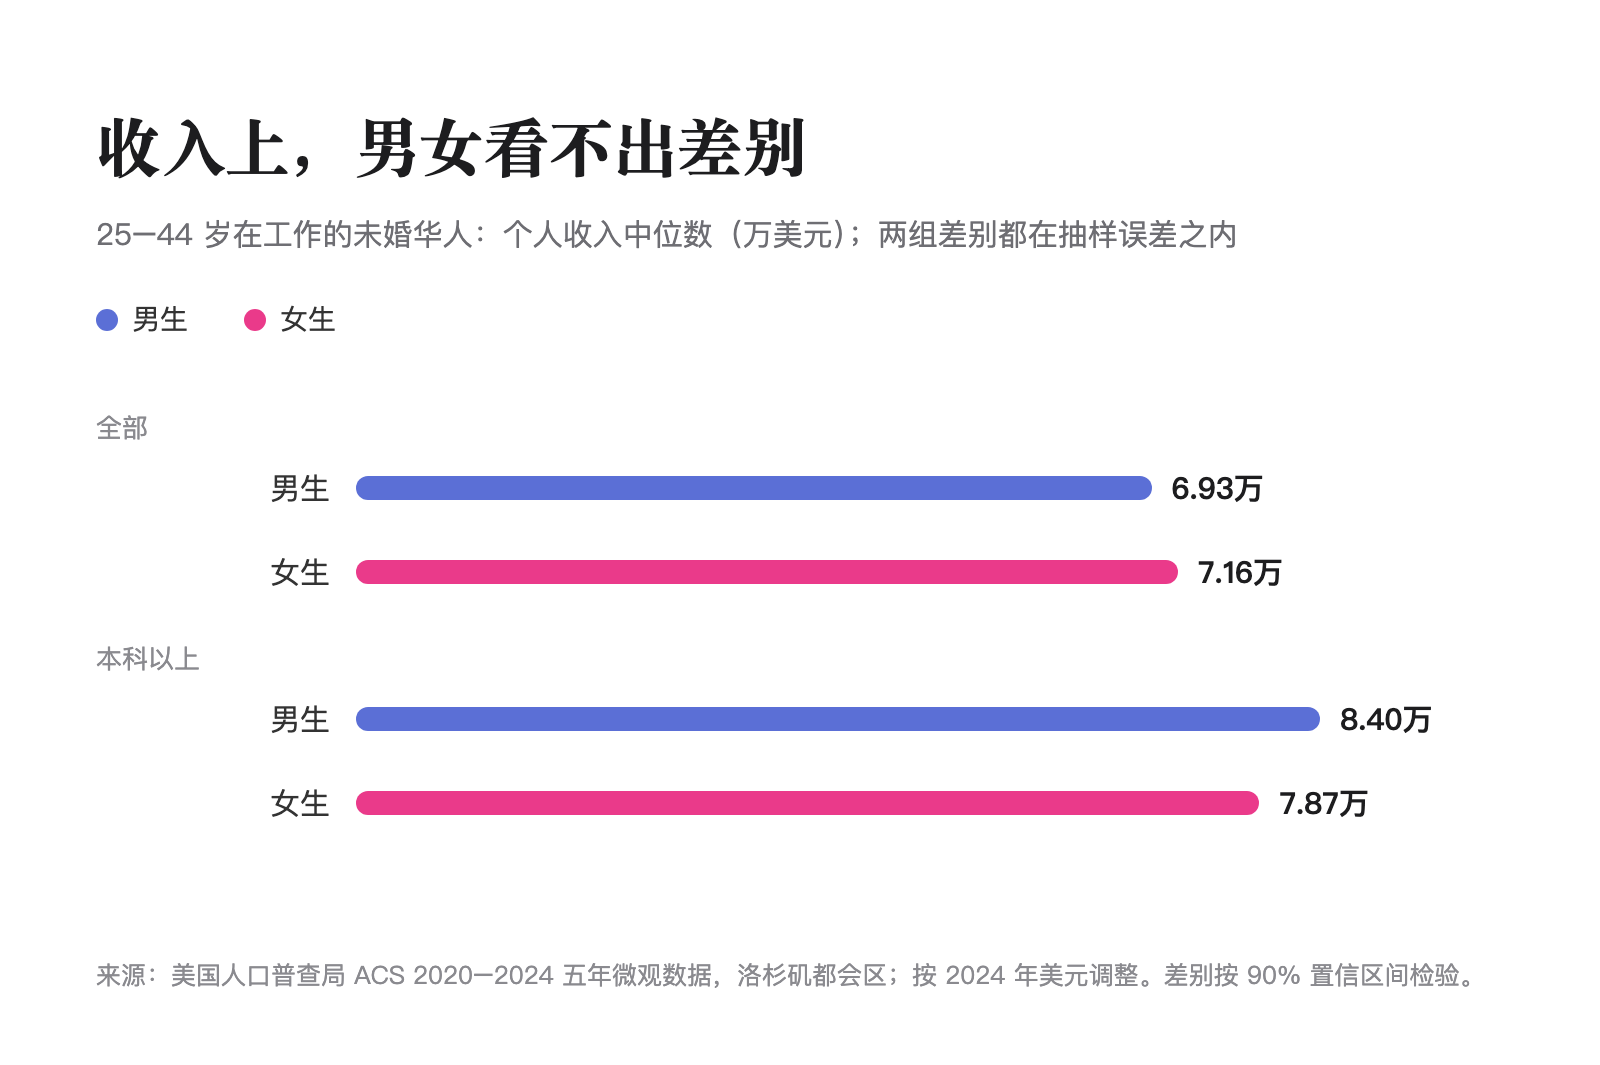
Now for the income question. Among employed, never-married Chinese people aged 25 to 44 in the LA metro area, the median personal income is about $71,600 for women and $69,300 for men. When you limit to just college-educated workers, men actually earn about $84,000 and women about $78,700. Neither difference is large enough to be statistically significant—they're both within the margin of error.
So here's the thing: "women are out-earning men" doesn't stand up in LA's single population. The education gap is real ("strong women"), but the income gap isn't ("weak men" doesn't follow). It's half the narrative.
Online Dating: LA Men Aren't Being Left Behind
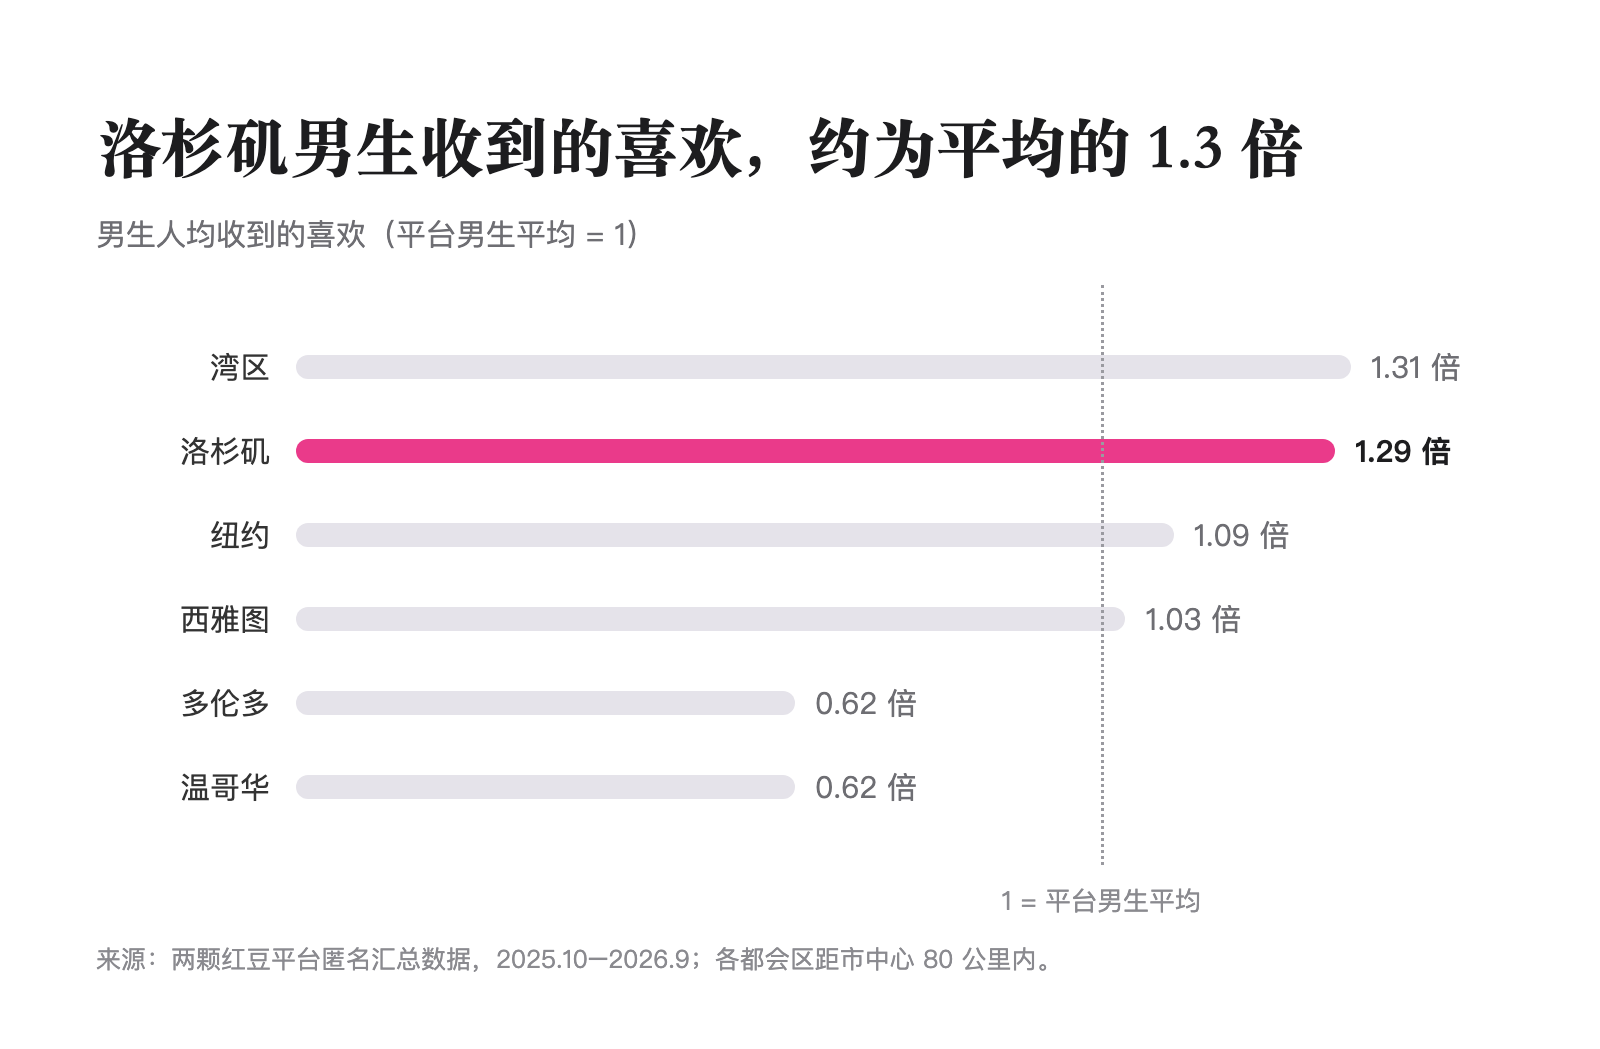
On the 2RedBeans platform, the ratio flips a bit. Among active members aged 25 to 44, LA has about 128 men for every 100 women—the most balanced ratio of the six major North American Chinese dating markets (LA, Bay Area, New York, Seattle, Toronto, Vancouver). The app skews male because it's where the actively looking people are. Every city does; the platform always has more men than the general census does.
Here's the key number: LA men get about 30% more likes than the platform average for men. That matches the Bay Area and beats New York (11% above average), Toronto, and Vancouver (both 40% below). LA women get about 13% more likes than average—basically tied with the Bay Area at 12%, and both are among the highest on the platform. New York women are just behind at 6% above average.
And another thing: the men filling out profiles on the app are educated too. Among LA members who listed their education, 84% of men have a bachelor's degree or higher, versus 75% of women.
It Goes Both Ways: LA and the Bay Area
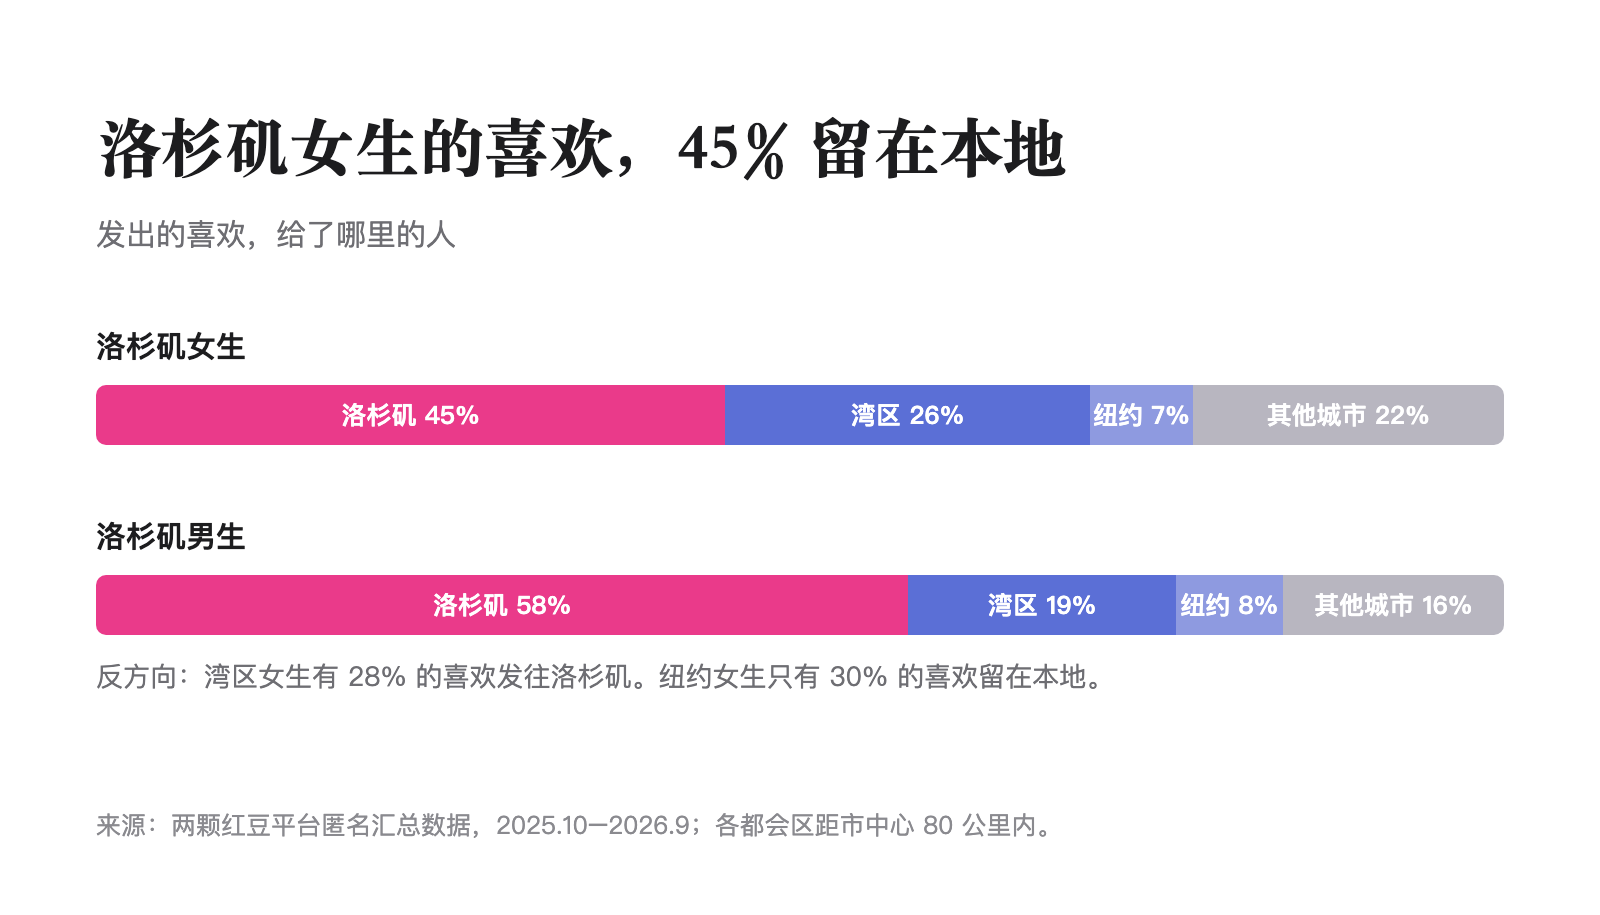
When LA women send likes, 45% go to LA men—the same as the Bay Area. Vancouver and Toronto are comparable (42% and 40% respectively). New York, though, is way lower at 30%. Where does the other 55% go? 26% goes north to the Bay Area.
It flows both ways, too. Bay Area women send 28% of their likes down to LA. There's a real two-way pipeline between Southern and Northern California.
So to circle back to that opening claim: LA's single women do have higher education levels and are more likely to be employed. That part's solid. But the income picture is a tie, and men are getting plenty of attention online. "Strong women"? The data says yes. "Weak men"? That one doesn't hold up.
How We Gathered This Data
-
Census Data: U.S. Census Bureau's American Community Survey (ACS) 2020–2024 public-use microdata sample (PUMS). "Chinese" means single-race ethnicity; "never-married" includes never-married, divorced, separated, and widowed. The LA metro area includes Los Angeles and Orange Counties. Education, income, and employment figures are based on never-married Chinese people aged 25–44. "Graduate degree or higher" means master's, professional, or doctoral degrees. Income figures are for employed individuals, reported as median personal income adjusted to 2024 dollars. All comparisons between regions and genders were calculated with 90% confidence intervals; we only report differences where the confidence interval doesn't cross zero (or 100, for gender ratios). If not met, we say "no statistically significant difference." Census data captures marital status, not dating status.
-
2RedBeans Platform Data: Active members are defined as real, visible, active within the past 90 days, with photos and birthdate. Likes reflect the 12 months preceding October 2026. Metro areas are defined as within 50 miles (80 km) of the city center. Likes per person are calculated relative to the platform average for each gender (1.0 = average). Education is self-reported by members who chose to fill out that field (roughly 80% of the base), and isn't age-restricted. All figures reflect opposite-gender interactions only between real accounts. This article reports percentages and ratios only.
If your profile is getting views but no responses, consider getting a second opinion. 2RedBeans' Profile Concierge service pairs you with an experienced matchmaker who'll review your photos, bio, and positioning one-on-one. Or, dive straight in and browse Chinese singles in Los Angeles.
Frequently Asked Questions
How many Chinese people are in LA?
According to the American Community Survey (ACS 2020–2024), the LA metro area (Los Angeles and Orange Counties) is home to roughly 600,000 Chinese residents. LA County accounts for about 475,000, and Orange County for about 125,000. Among those 18 and older, roughly 91,000 men and 120,000 women are never-married.
What's the gender ratio among LA's single Chinese people?
According to ACS 2020–2024 data, among never-married Chinese people aged 25–44 in the LA metro area, there are roughly 43,000 men and 42,000 women, or about 104 men per 100 women. That's statistically indistinguishable from a tie. LA County runs slightly more male at about 107 per 100.
Do single Chinese women in LA have higher education and income than men?
According to ACS 2020–2024, among never-married Chinese people aged 25–44 in LA: 79% of women have a bachelor's degree or higher, compared to 73% of men. On income, among employed individuals, the median is about $71,600 for women and $69,300 for men. When limited to college-educated workers, men earn roughly $84,000 and women $78,700. Neither income difference is statistically significant.
Are single Chinese men in LA popular on dating apps?
According to 2RedBeans platform data, LA men receive about 30% more likes than the platform average, matching the Bay Area and outpacing New York (11% above average), Toronto, and Vancouver (both 40% below). LA women receive about 13% more than average—on par with the Bay Area at 12%—and both markets rank among the highest on the platform.
Cover image generated by AI.